Maybe try this setup to visualize what is happening:
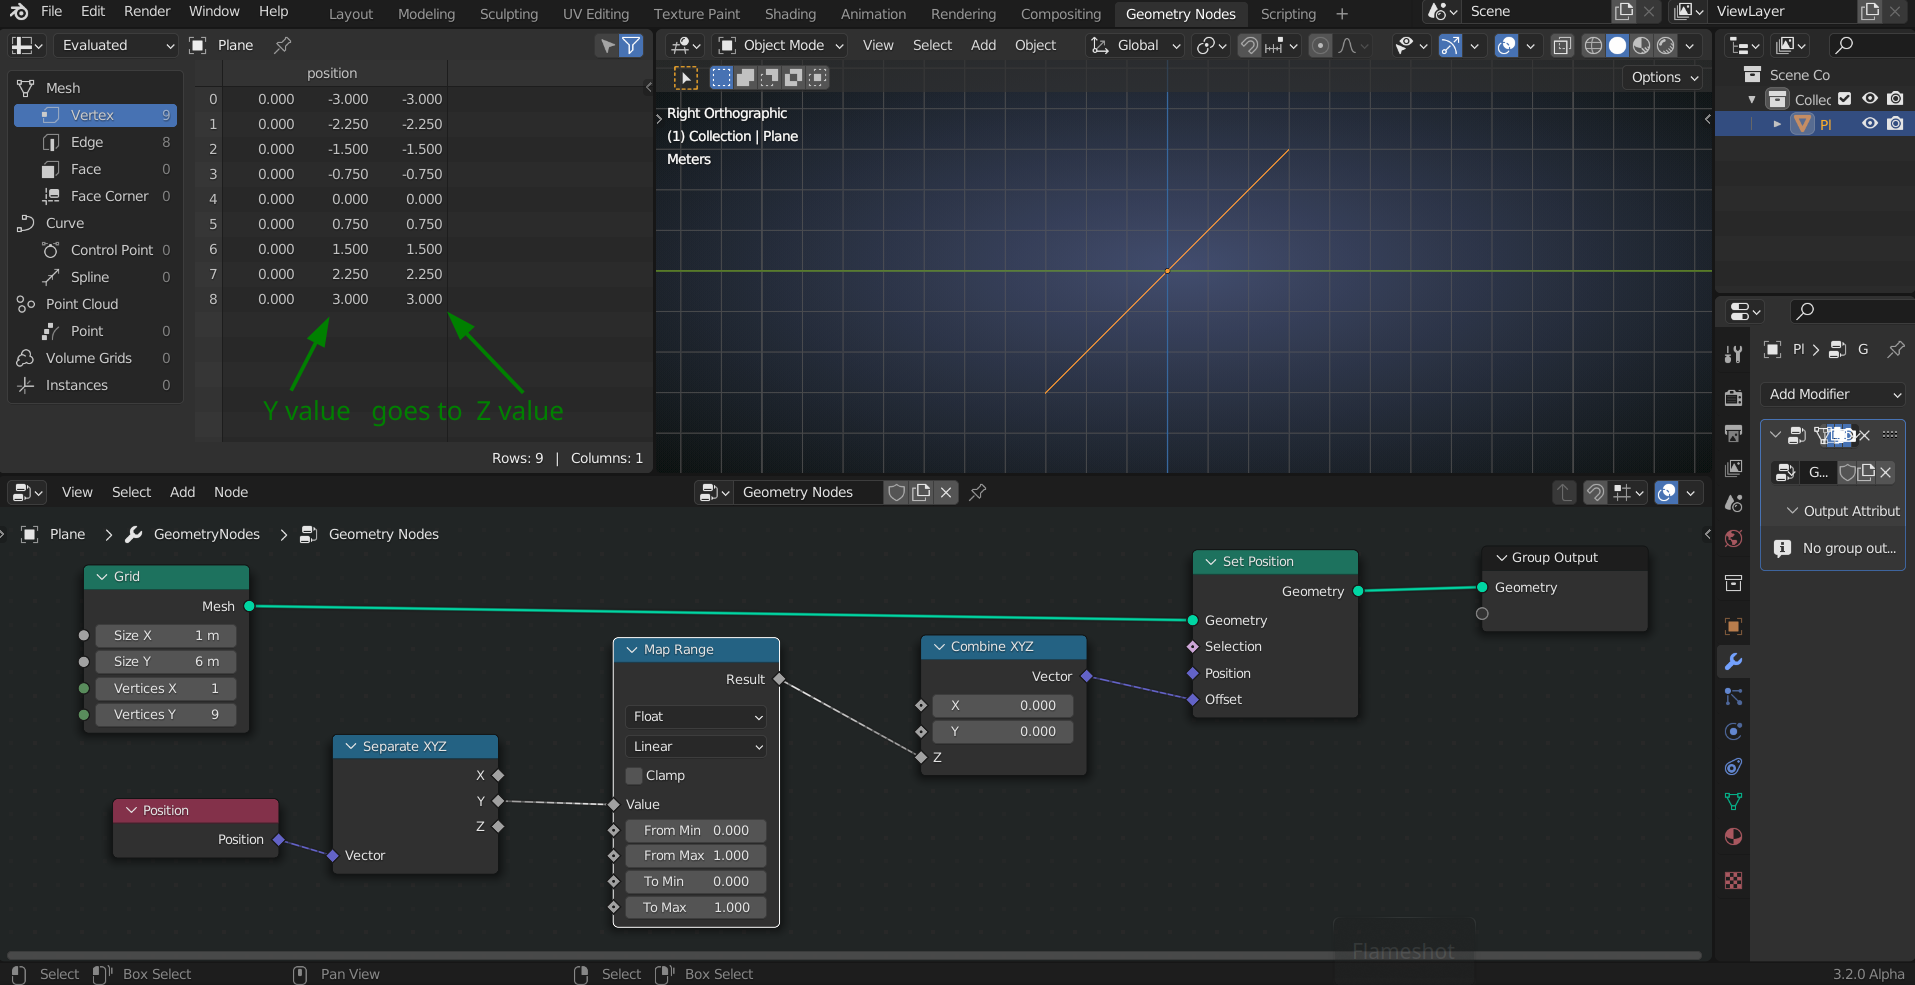 You can play with the values of the Map Range Node and see interactively in numbers (Spreadsheet) and graphically what is happening, how values are ‘transformed’.
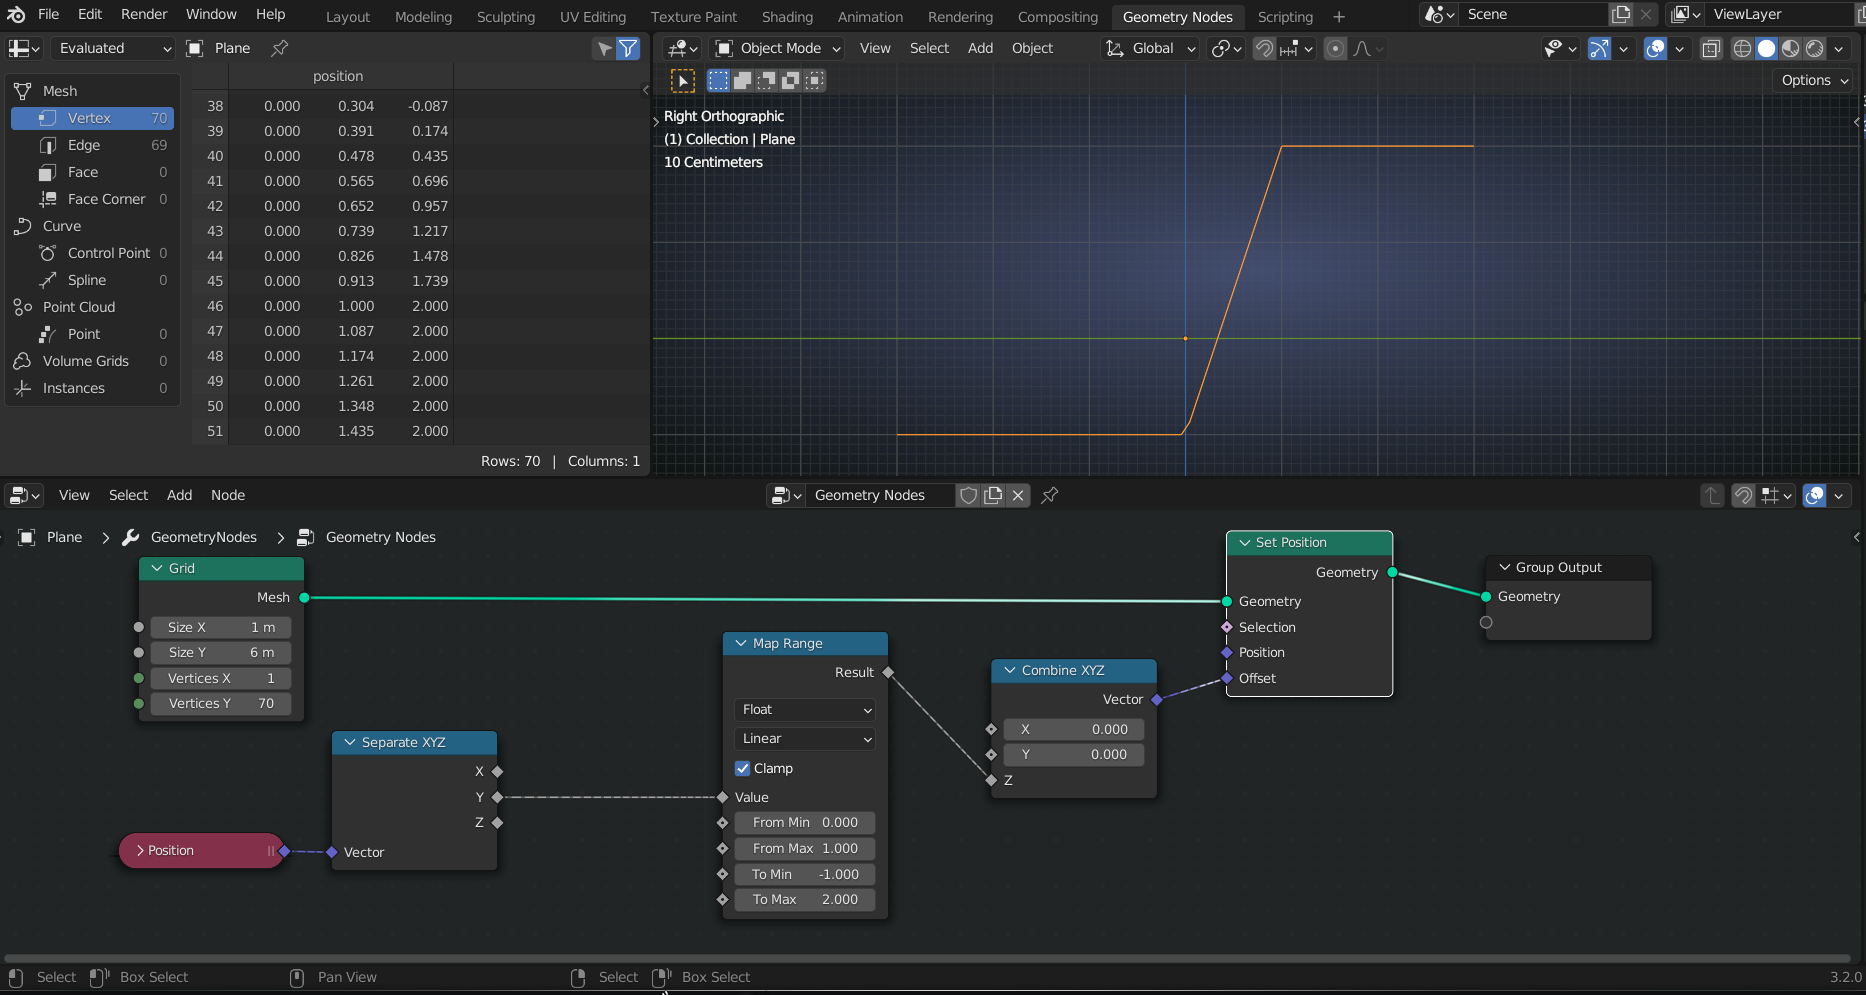
Increase the Vertex count in the Grid Node (higher resolution) for more graphical accuracy when using other interpolation methods, or Clamping.
About Clamping: @jlampel mentions that it clamps the output of the Map Range Node between 0 and 1, but that is not correct, it clamps the output between the To Min and To Max values:
 Hope this helps a bit.

